Introduction
(1) Oxygen flooding
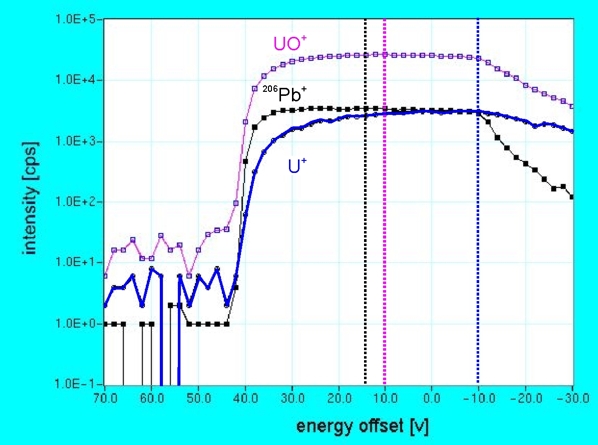
(2) Energy scan and offset
(3) Centering the ion image in the field aperture
(4) Mass calibration
(5) Presputtering and data acquisition
(6) Interelement calibration and precision
(1) Oxygen flooding
(2) Energy Scan and
Offset
(3)
Centering the ion image in the field aperature
Centering the secondary ion image in the center of the field aperture (FA) is necessary for each new analysis spot because primary beam
paths and conditions of secondary ion extraction vary over the area of the sample surface,in particular when spot-to-spot movements
over large distances (few mm) are required.
The sequence is as follows:
&bull Quit "Acquire"
&bull Go to "Tuning"
&bull Press: "Ions on" + "Circle Mode" + "Image" (Cameca Keyboard)
&bull Press: "LT1" + "Def A" + "Fast"(Cameca Keyboard)
&bull Use X and Y thumbwheel to center ion image in FA
If ion image is weak or not visible, slightly adjust "Mass" thumbwheel or increase gain using "Channel Plate" thumbwheel.
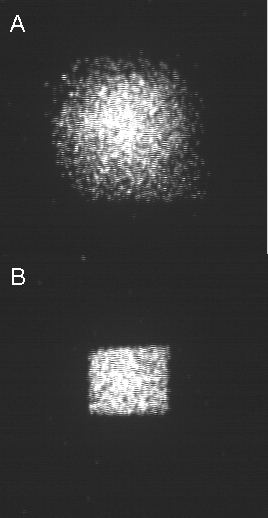
Figure to the right shows the HfO+ image on AS3 zircon (~25 micron spot) for FA width sufficiently large
to transmit the entire secondary ion beam (A), wheras B shows the effect of a smaller FA that blocks
incoming secondary ions from the periphery of the crater. This minimizes surficial Pb contamination from more slowly sputtered edges.
Note: "LT1 Def A" values for X and Y should be <1000. If not, repositioning of the primary beam is required!
&bull When centering is complete , press "Rectangle Mode" + "EM" (Monocollection) on Cameca Keyboard
&bull Quit "Tuning"
&bull Go to "Analysis Definition". This opens "analysis_definition.vi"
&bull Under "Condition" select "Edit Condition" (you may change cycle number, pre-sputter time in "analysis_condition.vi", or offsets in "analysis_species_table.vi")
&bull Under "Calibrate" select "Calibrate from Condition"
&bull In "calibration.vi" window, select "Calibration Aid Manual" and "Start". This will start the mass calibration procedure.
(4) Mass calibration
&bull Mass resolution (in "analysis_definition.vi" select "Anal. Par." and "Edit": type 5000 as mass resolution and confirm with "Set"). Note: if CIPS had to be restarted, the mass resolution is set to default = 300.
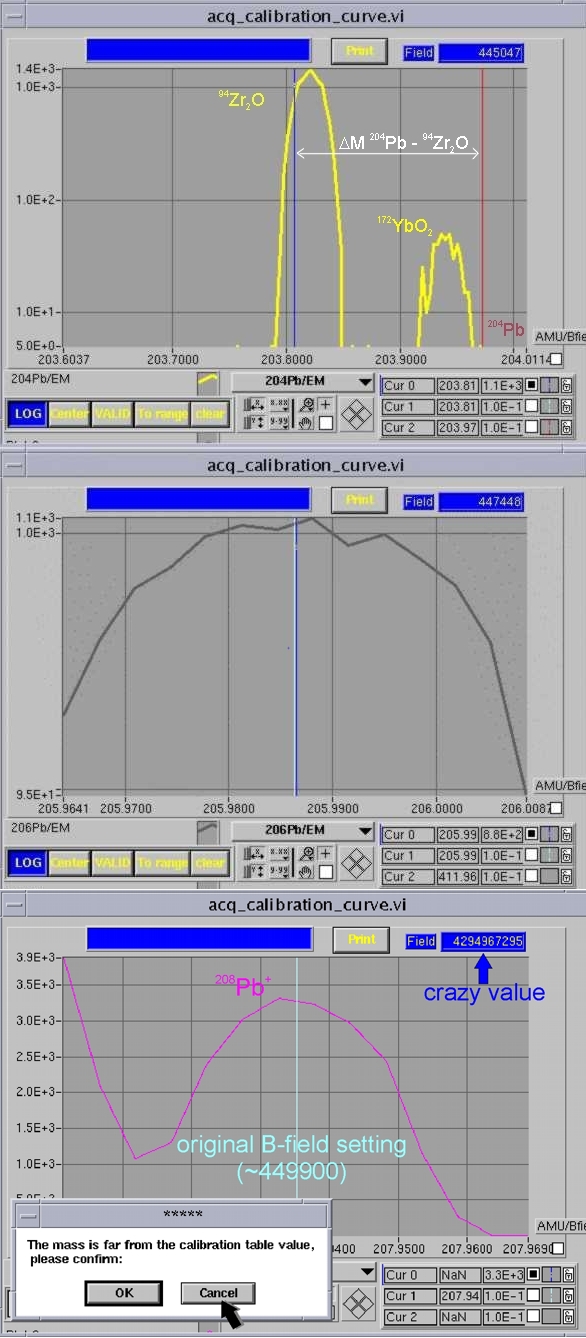
&bull #dM. Default is 4.0. Once all peaks are centered, #dM can be changed to 1.3 (except for 204Pb which should remain at 4.0 or - if peak is close to the margins of the mass window - be increased to 6.0).
Examples are shown for 204Pb, 206Pb, and 208Pb. Note that the 204Pb signal is typically too small to perform magnet centering on 204Pb directly. Instead, a nearby reference mass (94Zr2O) is used to center the magnet (blue cursor) whereas the B-filed during analysis is set for 204Pb (red cursor).
&bull If peak is well defined, press "Center" + "Valid"
&bull If intensities of 207Pb, 208Pb, or even 206Pb are low (<100 cps), be aware that there is a risk of miscentering the peak. This could also accidentally happen for the case a nearby intereference is higher in intensity (see Fig. for 208Pb).
&bull If miscentering accidentally has occurred (note "crazy" B-field value in 208Pb scan), a window "mass is far from the calibration..." pops up after pressing "valid". Select "cancel", go back to a previous mass, then again to the miscentered mass. This time, find peak manually by dragging cursor. If insecure about peak position, the following is recommended:
&bull Check mass centering on AS3 only; or
&bull Manually drag the cursor relative to how the B-field values changed on 94Zr2O+
&bull After cycling through all mass stations, press "Apply" on calibration.vi window. If masses were off by >10 bits, redo centering: "Quit" calibration.vi and "Calibrate from condition" again.
&bull "Apply" on "Analysis Definition"
&bull "Acquire" window pops up: you are ready to press "Start". Change sample name!
(5)
Presputtering and data acquisition
(6) Interelement
calibration and precision
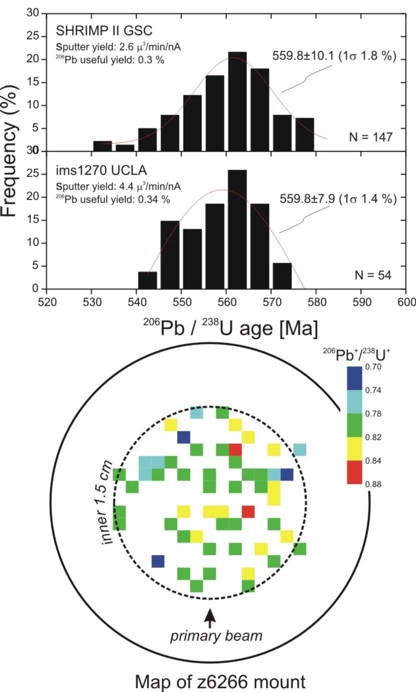
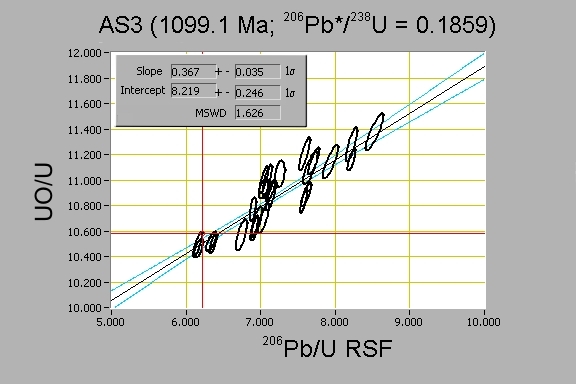
Interelement fractionation between U, Th and Pb during ion microprobe analysis is monitored using well-characterized standards of known isotopic composition (e.g., AS3, 91500). Resulting age uncertainties critically depend on how well this fractionation can be monitored. Typically, raw U-Pb ratios are corrected for common-Pb (e.g., by using the 204Pb signal). Interelement fractionation between U and Pb commonly varies between ~5 and ~10 (calculated as (Pb/U)measured/(Pb/U)true). These values are plotted as 206Pb+/U+ RSF (relative sensitivity factor) against UO+/U+ and regressed as a linear function (slopes of ~0.5±0.2 are typically determined). This allows for calibrating the U-Pb relative sensitivity as a function of UO+/U+ measured on the unknowns.
Literature:
Schmitz MD, Bowring SA, and Ireland T (2003) Evaluation of Duluth Complex anorthositic series (AS3) zircon as a U-Pb geochronological standard: New high-precision isotope dilution thermal ionization mass spectrometry results. GCA 67, 3665-3672
Stern RA, and Amelin, Y. (2003) Assessment of errors in SIMS zircon U-Pb geochronology using a natural zircon standard and NIST SRM 610 glass. Chem Geol 197, 111 142