| Journal of Geophysical Research |
|
||
| Volume XX, Issue XX | Abstract | |
| In press | Data Repository | |
| Pages XX-XX | Thermobarometric Data | |
| Geochronologic Data | ||
| Full text | ||
| Copyright © 2001 American Geophysical Union. All rights reserved. | ||
Geochronologic and Thermobarometric Constraints on the Evolution of the Main Central Thrust, central Nepal Himalaya
E.J. Catlos![]() ,
, ![]() , 1, T. Mark Harrison1, Matthew J. Kohn2,
Marty Grove1, F.J. Ryerson3, Craig E. Manning1, B.N.
Upreti4
, 1, T. Mark Harrison1, Matthew J. Kohn2,
Marty Grove1, F.J. Ryerson3, Craig E. Manning1, B.N.
Upreti4
1.Department of Earth and Space Sciences and Institute of Geophysics and Planetary Physics, University of California, Los Angeles, California, 90095-1567, USA
2.Department of Geological Sciences, University of South Carolina, Columbia, South Carolina, 29208, USA
3.Institute for Geophysics and Planetary Physics, Lawrence Livermore National Laboratory, Livermore, California, 94550, USA
4.Department of Geology, Tri-Chandra Campus, Tribhuvan University, Kathmandu, Nepal
Received April 20, 2000; revised September 22, 2000; accepted October 10, 2000.
The Main Central Thrust (MCT) juxtaposes the high-grade Greater Himalayan Crystallines over the lower-grade Lesser Himalaya Formations; an apparent inverted metamorphic sequence characterizes the shear zone that underlies the thrust. Garnet-bearing assemblages sampled along the Marysandi River and Darondi Khola in the Annapurna region of central Nepal show striking differences in garnet zoning of Mn, Ca, Mg, and Fe above and below the MCT. Thermobarometry of MCT footwall rocks yield apparent inverted temperature and pressure gradients of ~18° C/km and ~0.06 km/MPa, respectively. Pressure-temperature (P-T) paths calculated for upper Lesser Himalaya samples that preserve prograde compositions show evidence of decompression during heating, whereas garnets from the structurally lower sequences grew during an increase in both pressure and temperature. In situ (i.e., analyzed in thin section) ion microprobe ages of monazites from rocks immediately beneath the Greater Himalayan Crystallines yield ages from 18-22 Ma whereas Late Miocene and Pliocene monazite ages characterize rocks within the apparent inverted metamorphic sequence. A Lesser Himalayan sample collected near the garnet isograd along the Marysandi River transect contains 3.3±0.1 Ma monazite grains (P » 0.72 GPa, T » 535°C). This remarkably young age suggests that this portion of the MCT shear zone accommodated a minimum of ~30 km of slip over the last 3 m.y. (i.e., a slip rate of >10 mm/yr) and thus could account for nearly half of the convergence across the Himalaya in this period. The distribution of ages and P-T histories reported here are consistent with a thermo-kinematic model in which the inverted metamorphic sequences underlying the MCT formed by the transposition of right-way-up metamorphic sequences during Late Miocene-Pliocene shearing.
All data tables and figures are given in PDF format and can be accessed if you download
Adobe Acrobat Reader ![]() . This program is free
of charge.
. This program is free
of charge.
Detailed electron microprobe analyses of Marysandi River samples: |
Brief summary of mineral compositions: |
||||||
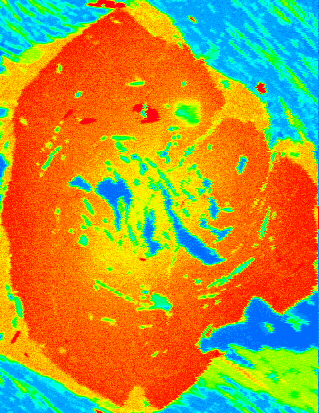
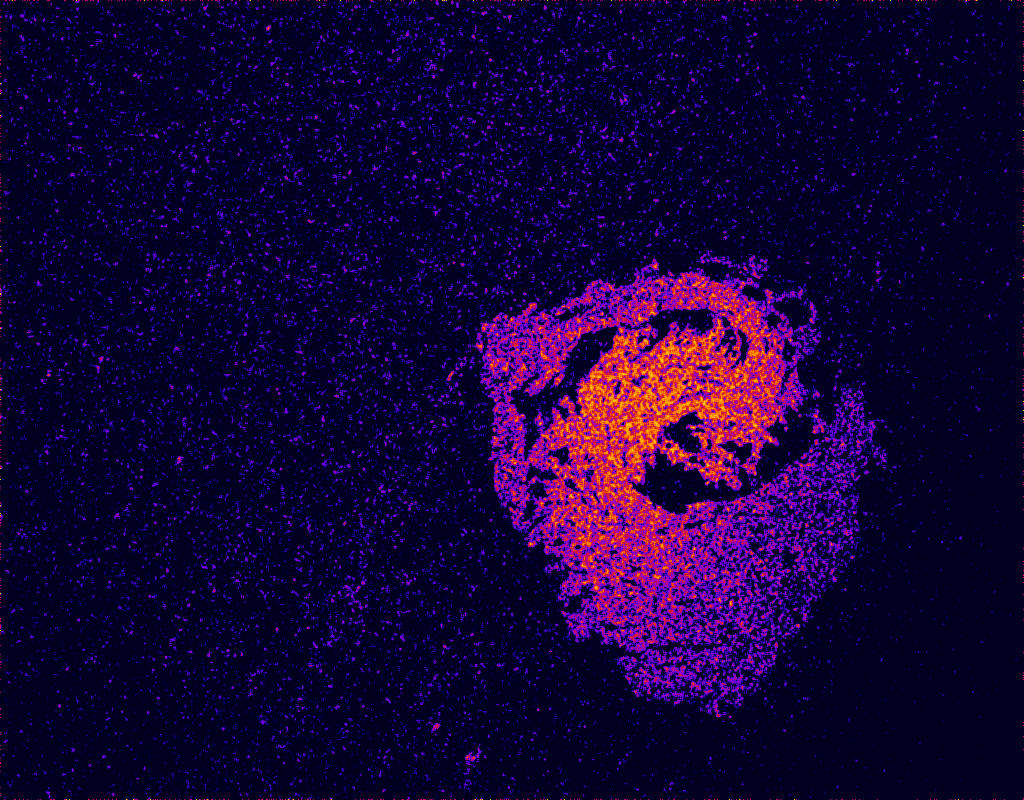
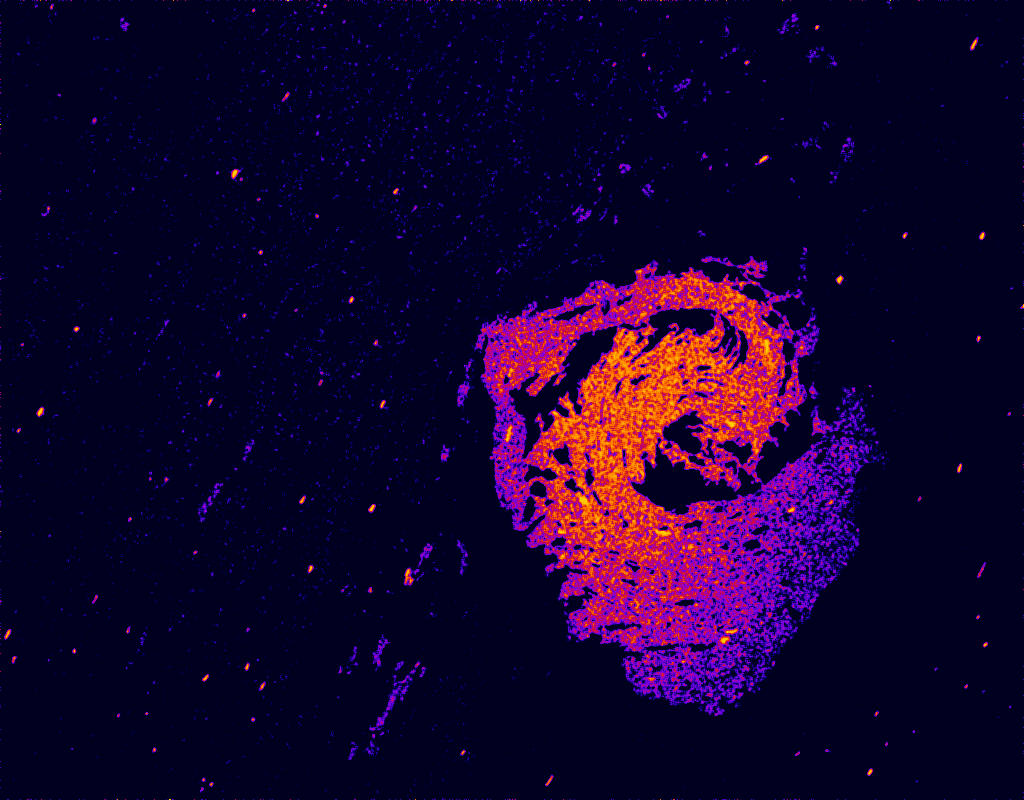
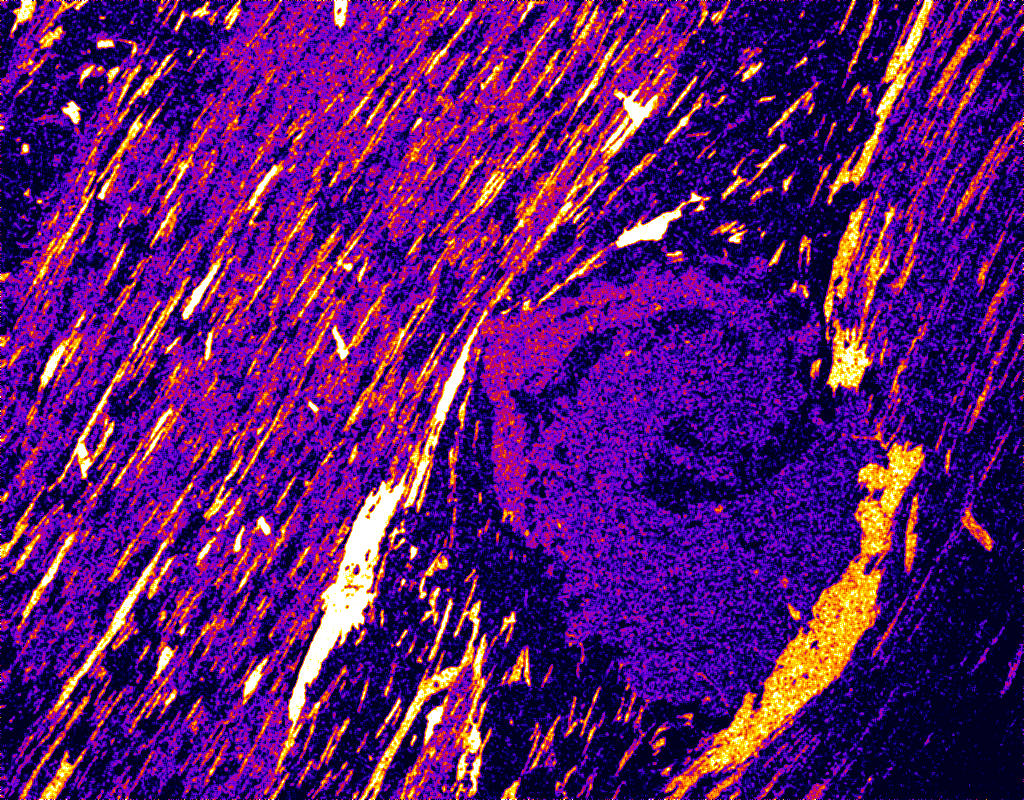
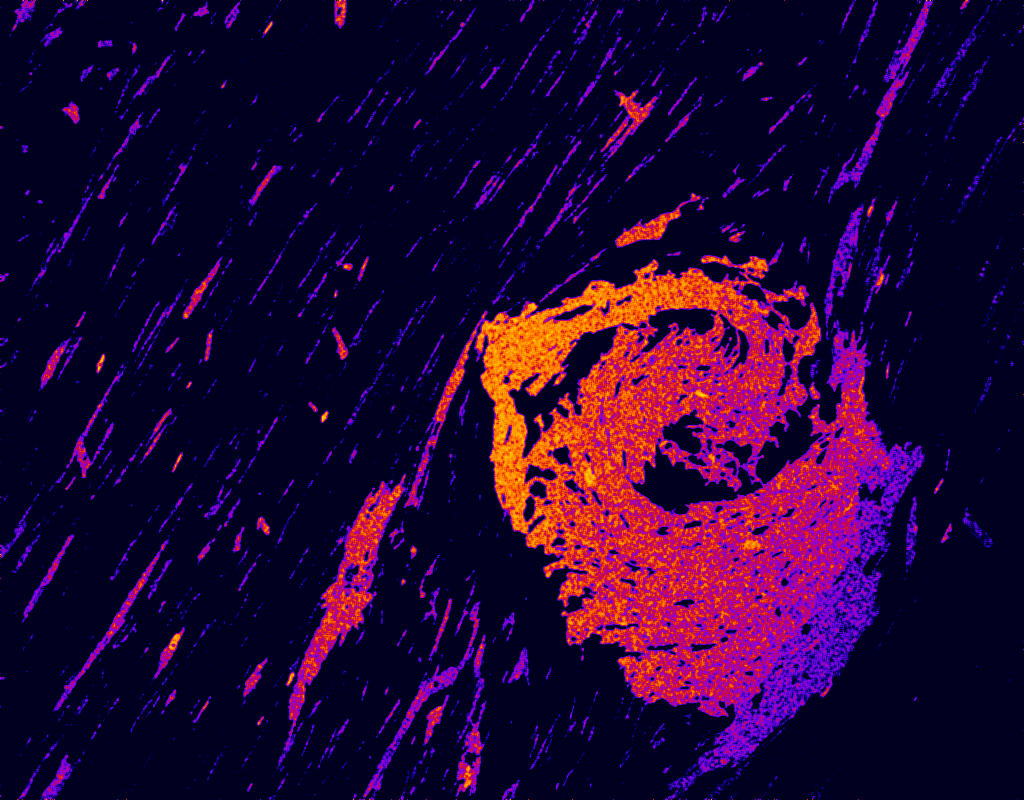
X-ray element maps of Marysandi River garnets: |
|||||||
| MA25(grt1) | MA25(grt2) | ||||||
| MA49(grt1) | MA49(grt2) | Ma45(grt1) | MA45(grt2) | ||||
| MA45(grts3&4) | MA27(grt1) | MA27(grts2&3) | MA27(grt4) | ||||
| MA27(grt5) | MA43(grt1) | MA43(grt2) | MA43(grt3) | ||||
| MA61(grt1) | MA61(grt2) | MA65 | |||||
| MA74(grt1) | MA74(grt2) | MA86 | |||||
| Adjust the brightness/contrast of these maps yourself. For the scale bars, see the pdf files above. Just download the .tif or .jpg file and open them using Image J (PC) or NIH Image (Mac). These programs are free of charge. | |||||||
| Sample | Mn | Ca | Mg | Fe | |||
MA24 |
174KB | 174KB | 170KB | 174KB | |||
| MA25(grt1) | 143KB | 143KB | 138KB | 143KB | |||
| MA25(grt2) | 392KB | 392KB | 392KB | 291KB | |||
| MA25(grt3) | 198KB | 198KB | 198KB | 198KB | |||
| MA49(grt1) | 127KB | 127KB | 127KB | 127KB | |||
| MA49(grt2) | 479KB | 479KB | 479KB | 479KB | |||
| MA45(grt1) | 140KB | 140KB | 140KB | 140KB | |||
| MA45(grt2) | 223KB | 223KB | 223KB | 223KB | |||
| MA45(grts3&4) | 232KB | 232KB | 232KB | 232KB | |||
| MA27(grt1) | 158KB | 158KB | 158KB | 158KB | |||
| MA27(grts2&3) | 404KB | 404KB | 404KB | 404KB | |||
| MA27(grt4) | 264KB | 264KB | 264KB | 264KB | |||
| MA27(grt5) | 173KB | 173KB | 173KB | 173KB | |||
| MA43(grt1) | 81KB | 81KB | 81KB | 81KB | |||
| MA43(grt2) | 350KB | 350KB | 350KB | 350KB | |||
| MA43(grt3) | 95KB | 95KB | 95KB | 95KB | |||
| MA81 | 446KB | 446KB | 446KB | 446KB | |||
| MA79(grt1) | 343KB | 343KB | 343KB | 343KB | |||
| MA79(grt2) | 340KB | 340KB | 340KB | 340KB | |||
| MA33 | 142KB | 142KB | 142KB | 142KB | |||
| MA83 | 100KB | 100KB | 100KB | 100KB | |||
| MA61 | 138KB | 135KB | 130KB | 264KB | |||
| MA65 | 802KB | 802KB | 802KB | 802KB | |||
| MA74 | 801KB | 801KB | 801KB | 801KB | |||
| MA86 | 227KB | 212KB | 573KB | 150KB | |||
Detailed Th-Pb ion microprobe analyses of Himalayan monazite grains |
|||||||
| BSE images of dated central Nepal monazite grains | |||||||
| MA11 | MA15 | MA18 | MA19 | ||||
| MA25 | MA27 | MA33 | MA45 | ||||
| MA48 | MA65 | MA83 | MA84 | ||||
| MA86 (P1) (P2) | DH30 | DH39 | DH51 | ||||
| DH58(reflected lt) | DH71 | DH73 | DH75 | ||||
| 40Ar/39Ar analyses of Himalayan muscovite | |||||||
| Upper Lesser Himalaya | |||||||
Inverse isochron plots |
|||||||
| Greater Himalayan Crystallines | |||||||
| Upper Lesser Himalaya (P1) (P2) (P3) | |||||||
| Lower Lesser Himalaya (P1) (P2) | |||||||
| 3. Full manuscript text | |||||||
| Manuscript text | |||||||
| Figure Captions | |||||||
| Manuscript tables | |||||||
| Table 1. Mineral compositions used for P-T path modeling. | |||||||
| Table 2. Th-Pb ages of spots on central Nepal monazite grains. | |||||||
| Table 3. Summary of muscovite K-Ar analyses. | |||||||
| Manuscript figures | |||||||
| Figure 1. Geologic map of the Himalayan range | |||||||
| Figure 2. Geologic map of the Annapurna-Manaslu-Ganesh region of central Nepal. | |||||||
| Figure 3. Sample location map from rocks collected along the Marysandi River. | |||||||
| Figure 4. Sample location map from rocks collected along the Darondi Khola. | |||||||
| Figure 5. Geologic cross-sections along the Marysandi River and Darondi Khola transects. | |||||||
| Figure 6. Particle and P-T path predicted for a Lesser Himalaya rock if the MCT experienced a single episode of slip. | |||||||
| Figure 7. Particle and P-T path predicted for a Lesser Himalaya Formation rock if the footwall experienced two episodes faulting. | |||||||
| Figure 8. Electron-microprobe X-ray element maps of a Domain 1 garnet. | |||||||
| Figure 9. Electron-microprobe X-ray element maps of Domain 2 garnets. | |||||||
| Figure 10. Electron-microprobe X-ray element maps of a Domain 3 garnet. | |||||||
| Figure 11. Mole fractions of spessartine, grossular, and Fe/(Fe+Mg) across garnets from Domain 1, 2, and 3. | |||||||
| Figure 12. Thermobarometric results from central Nepal samples plotted versus structural distance from the MCT. | |||||||
| Figure 13. Metamorphic pressures and temperatures and P-T paths calculated for central Nepal garnet-bearing assemblages. | |||||||
| Figure 14. BSE images of Domain 1 sample MA45 with monazite age information (1s) indicated. | |||||||
| Figure 15. BSE images of Domain 2 samples MA33 and MA83 with monazite age information (1s) indicated. | |||||||
| Figure 16. BSE image of Domain 3 sample MA84 with monazite age information (1s) indicated. | |||||||
| Figure 17. BSE images of Domain 3 sample MA86 with monazite age information (1s) indicated. | |||||||
| Figure 18. Th-Pb monazite and 40Ar/39Ar mica age distribution map along the Marysandi River. | |||||||
| Figure 19. Weighted mean Th-Pb monazite and 40Ar/39Ar mica age distribution map along the Darondi Khola. | |||||||
| Figure 20. Th-Pb monazite ages of central Nepal samples plotted versus structural distance normal to MCT. | |||||||
![]() Corresponding
author. Tel.: (310) 206-2940; Fax: (310) 825-2779; Email: catlos@argon.ess.ucla.edu; Web page: http://oro.ess.ucla.edu/~catlos/
Corresponding
author. Tel.: (310) 206-2940; Fax: (310) 825-2779; Email: catlos@argon.ess.ucla.edu; Web page: http://oro.ess.ucla.edu/~catlos/
| Journal of Geophysical Research | Summary Article Journal Format-PDF (XXX K) |
| Volume XX, Issue XX | |
| In press | |
| Pages XX-XX |